
New Elastic 7.2 release also focuses on improved user experience with Metrics Explorer and Kubernetes services monitoring with new cloud-native data integrations
Elastic N.V. (NYSE: ESTC) (“Elastic”), the company behind Elasticsearch and the Elastic Stack, is excited to share with you our unbounded enthusiasm for improving tools available to operators keeping applications and services available, healthy, and fast. Whether or not you refer to this goal as “observability,” read on!
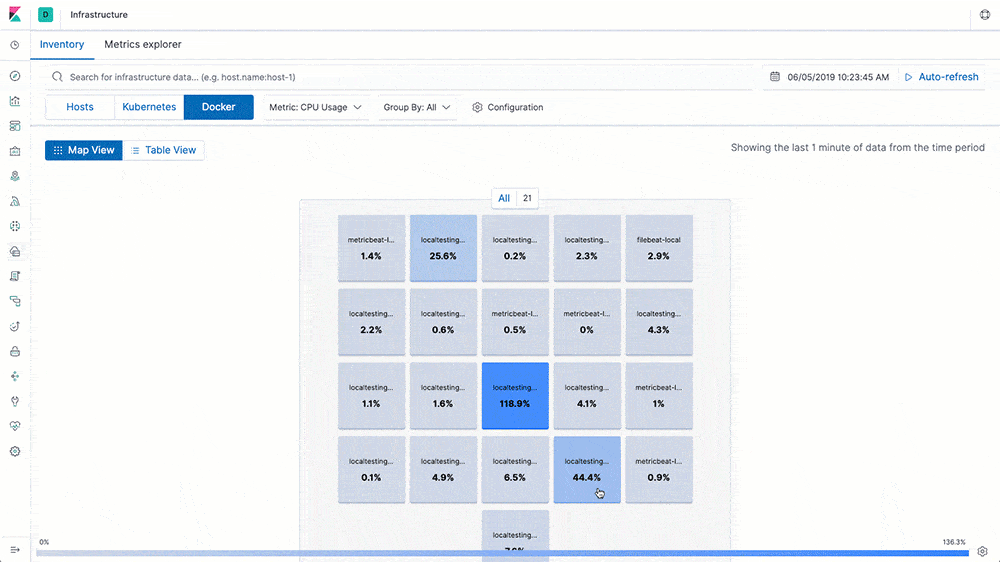
Elastic APM adds support for .NET, with the beta release of the highly requested .NET Agent. On the infrastructure monitoring front, we added the Metrics Explorer — a new view in the Infrastructure app in Kibana that is designed to enhance how you interact with infrastructure metrics in an ad hoc way. Finally, we continued to widen the Kubernetes monitoring tooling in 7.2 with the launch of several new data integrations for cloud-native technologies, such as CoreDNS and CRI-O.
If you cannot wait, version 7.2 is available now on our Elasticsearch Service — the only hosted Elasticsearch offering that includes these new features. Or you can download the latest version of the Elastic Stack.
The Elastic approach to observability
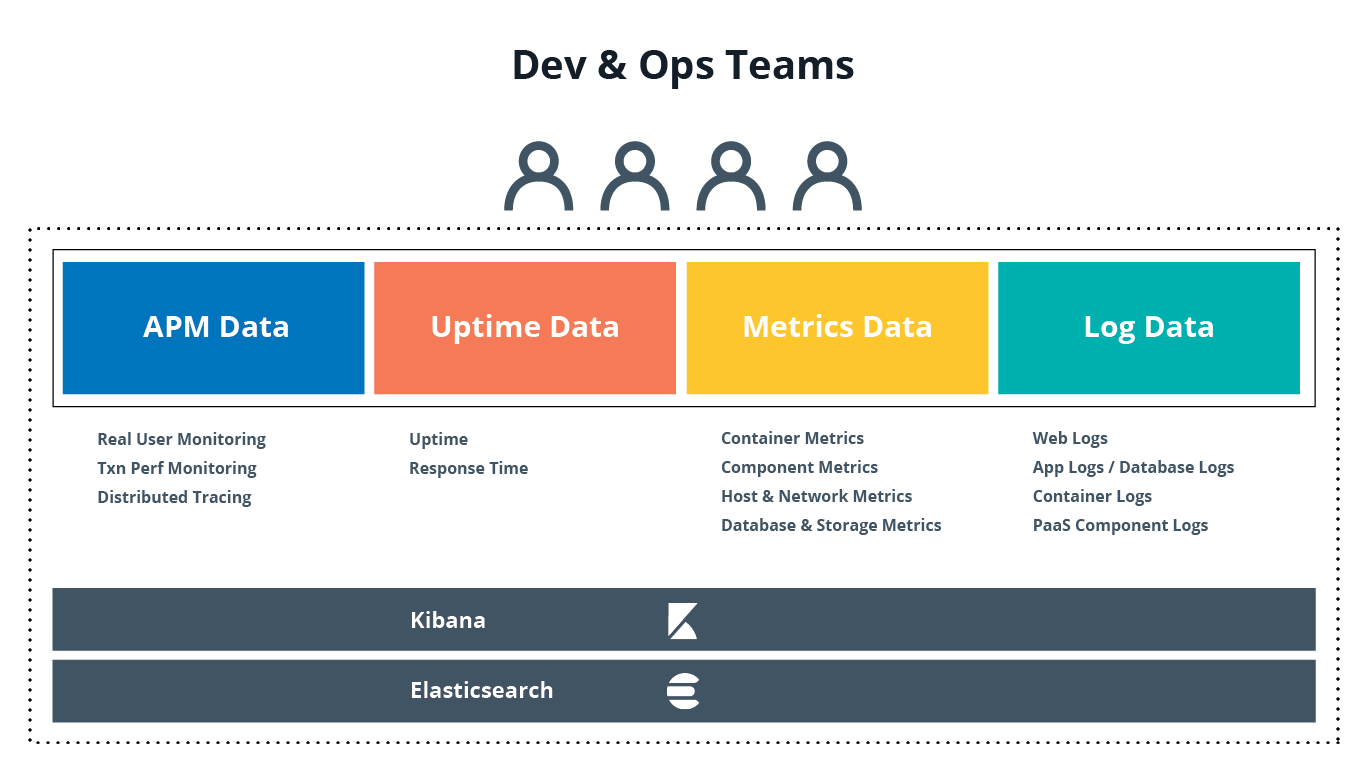
The term "observability" describes a philosophy that emphasizes unified visibility into the health of systems, services, and applications. While it's a newer term in the industry, it effectively captures the main reason that many users and their teams are turning towards the Elastic Stack for their operational needs. Due to the flexible nature of Elasticsearch, where everything is just an index, users are able to successfully bring together logs, metrics, traces, and uptime metrics — which were traditionally disparate data sources — into a single operational store.
We have adopted a dual strategy in the observability space: continue to deliver best-in-class experiences for each "pillar" of observability, while simultaneously supporting how these data streams come together for users in more natural and fluid ways. All observability data adheres to the Elastic Common Schema (ECS) and all Kibana applications are integrated to provide one-click navigation and data correlation workflows.
Red Wing Shoes, an iconic manufacturer of safety footwear, relies on hosted Elasticsearch Service in Elastic Cloud to gain unified visibility into the manufacturing process on the factory floor, the health of its e-commerce website, and operations at over 600 retail store locations around the world. The team responsible for operations also leads the rollout of new applications and services aimed to grow the business. "We are able to do this with a tight-knit team because we focus on making our IT operations efficient," said Marc Kermisch, Vice President and Chief Information Officer. "Seeing all the relevant operational data in a single datastore and UI interface has helped us get more effective at triaging and resolving issues based on actionable data. And the fact that the stack is fully managed for us in Elastic Cloud means our administrative overhead is low — all the deployment, scaling, and upgrades for the Elastic Stack happen at a click of a button."
Read more about our take on this important trend in our Observability with the Elastic Stack blog.
In 7.2, we continue to broaden and deepen our observability initiatives with the following product enhancements.


